Event-related responses in pupil size and fMRI measurements
It’s essential to understand the signals you’re looking at. The standard approaches to fMRI analysis assume the haemodynamic impulse-response function has a specific shape. Although slight changes in its timing and shape can be accounted for, it is nonetheless important to inspect the shapes of the event-related responses in one’s data. One way to correctly fit these event-related responses is to use linear regression to estimate the finite impulse-response caused by specific types of events.
Finite impulse response fitting has some advantages over and above event-related averages. If the impulse-response your data were filtered by is slow, i.e. a low-pass filter, it may be the case that responses to multiple events overlap. This causes problems for epoch-based event-related averaging, since some parts of the data will end up in the event-related responses of several different event types. Provided enough events of all types are present in the experiment (aided even more when inter-event periods are randomly drawn from an exponential distribution), deconvolution can take into account this overlap and correctly attribute the signal to specific types of events, assuming an LTI generative process.
In practice
We have created a python class package, nideconv, to do this. This package makes it very easy to perform quite sophisticated analyses, distilling event-related responses from timeseries signals. See the readthedocs website, and a more in depth explanation of both the background and how to use this awesome package.
Briefly:
Nideconv can fit FIR models, but also use other basis sets, such as Fourier or Legendre polynomials. It can perform OLS regression, or Ridge (L2) regression. When you have a dataset consisting of multiple subjects for example, nideconv allows you to estimate group responses using fully MCMC sampled Bayesian methods – all with very simple code.
import nideconv as nd
# tseries_raw is a numpy array (X, n)
# X timeseries of n timepoints sampled at a TR of 0.945s
# and it is used here in percent signal change format, after high-pass filtering
rf = nd.ResponseFitter(input_signal=tseries_raw,
sample_rate=1/0.945)
n_regressors = 23
rf.add_event(event_name='stim',
onsets=stim_times,
basis_set='fourier',
n_regressors=n_regressors,
interval=[0,25])
rf.add_event(event_name='blink',
onsets=blink_times,
basis_set='fourier',
n_regressors=n_regressors,
interval=[0,25])
rf.add_event(event_name='sacc',
onsets=sacc_times,
basis_set='fourier',
n_regressors=n_regressors,
interval=[0,25])
rf.fit()
# that's all. you can get timecourses for some type of event by:
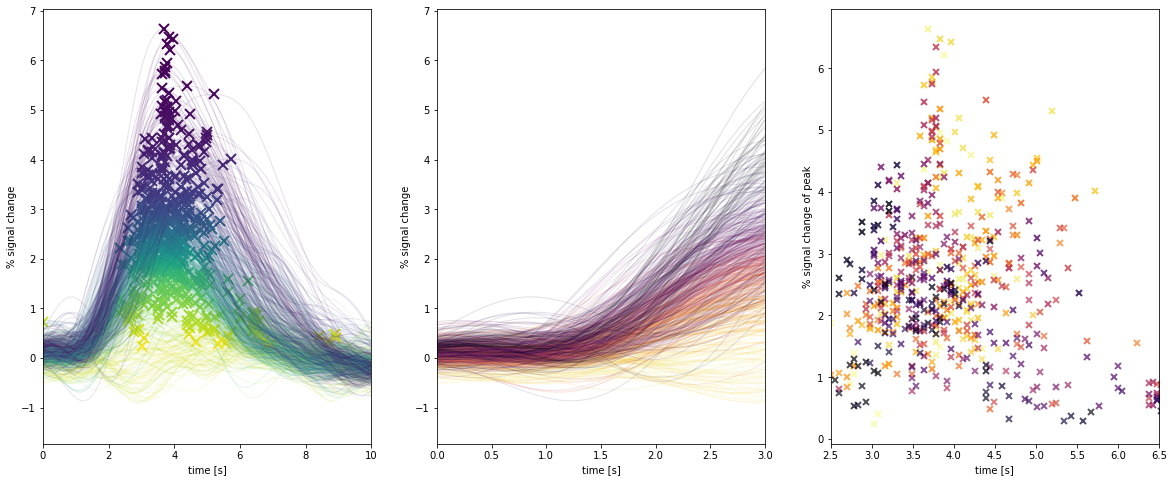
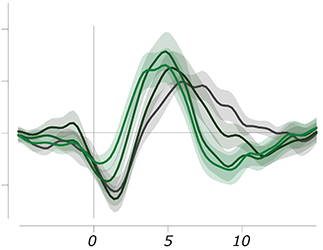
rf.events['stim'].get_timecourses()And this code might return the type of curves shown in the figure below, which shows the V1 BOLD responses to a single stimulus fit with the above code. You can immediately start to inspect things like time-to-peak, amplitude, onset shape, etc. etc.
We encourage you to give this package a try when you have fMRI data from voxels, ROIs, or pupil size timeseries data.